
Tools
Statistics you can
put to work
Interactive applications we've built for the questions that come up again and again on the production floor. Free to use, no signup, with example data included — and a working demonstration of the custom tools we build for client teams.
Featured tool
Process Capability Explorer
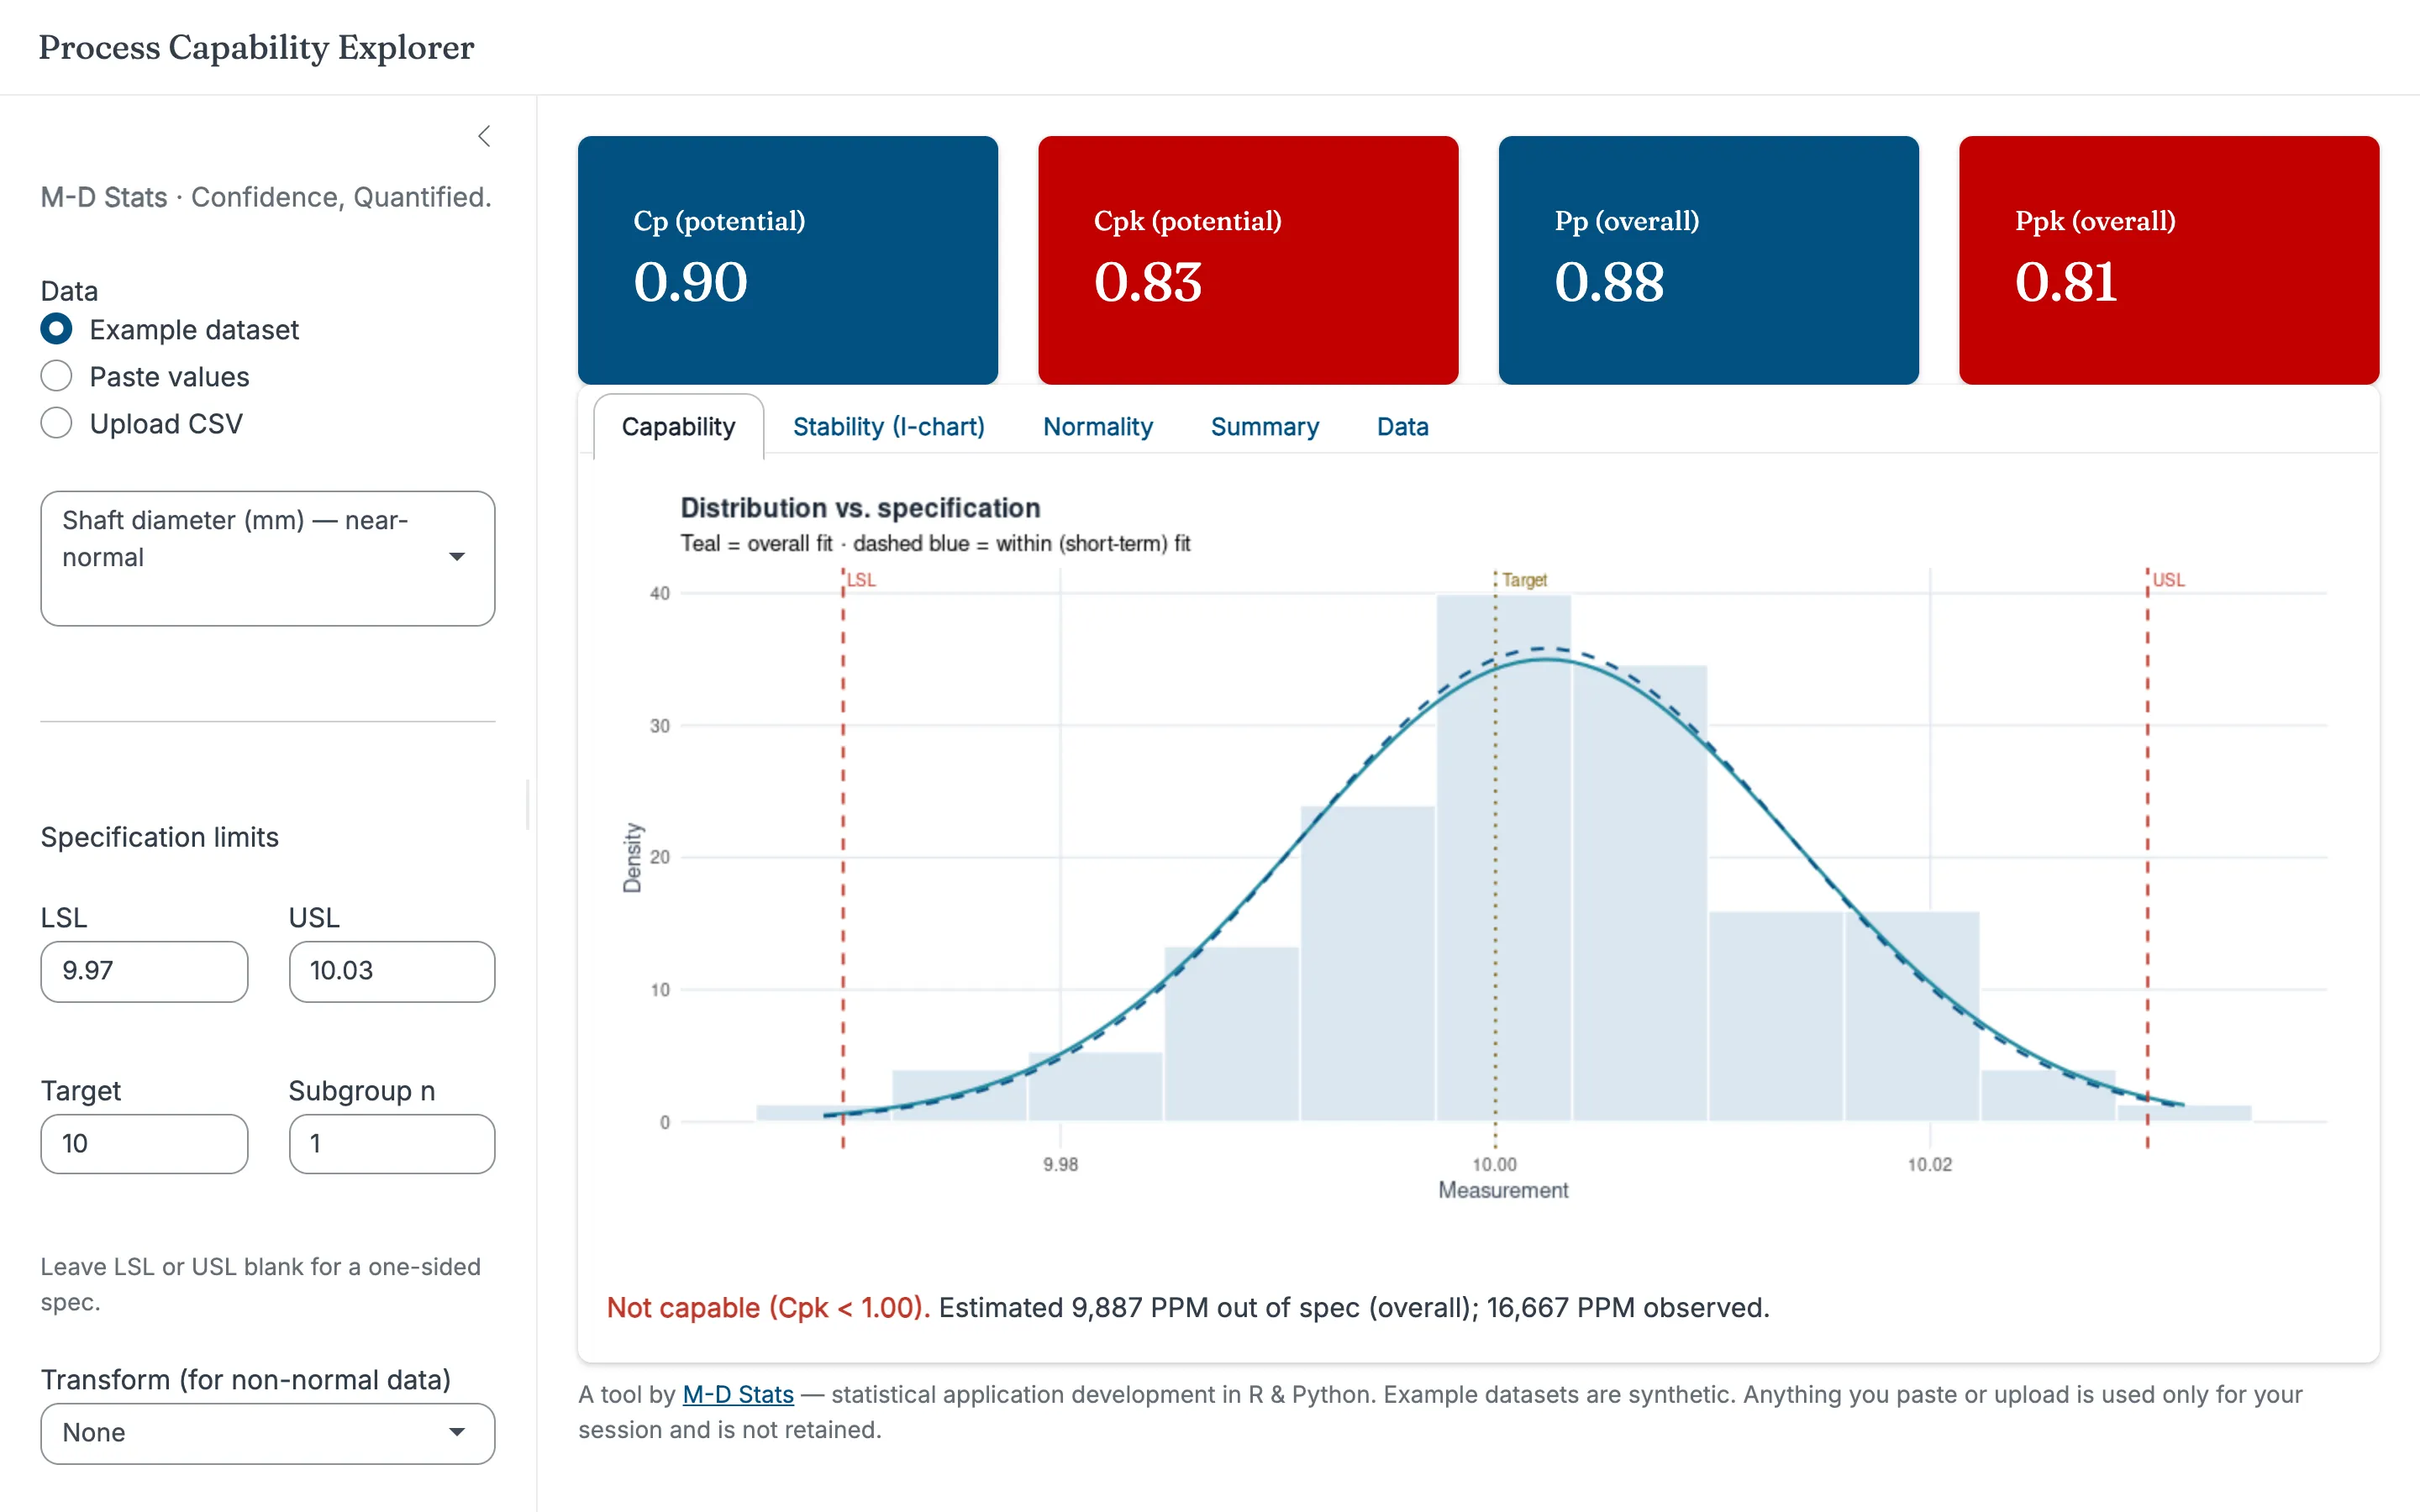
Load your measurements, set the specification limits, and get a complete capability read-out — indices, expected and observed defect rates, and the distribution against your spec — with the stability and normality checks that decide whether the numbers mean anything at all.
- Cp, Cpk, Pp, Ppk and Cpm, plus Z-bench and expected vs. observed PPM
- Distribution-vs-specification plot with within (short-term) and overall fits
- Individuals chart — because capability is only valid on a stable process
- Normality check (Q-Q + Shapiro-Wilk) with optional Log / Box-Cox transform
- One- or two-sided specs, rational subgroups, and CSV / PNG export
New tool
OC Curve & Sampling Plan Explorer
Enter the sampling plan from your procedure and see what it actually delivers — not just the AQL you chose, but the RQL that bounds how much defective product can reach a patient. Design a plan from risk points, or put two plans on the same axis and watch them diverge.
- AQL, RQL and AOQL for any attribute plan, with the full operating characteristic curve
- Plan design from producer and consumer risk points — state the risks, get n and c
- Binomial or hypergeometric model, because lot size changes the answer on small lots
- Two plans on one axis, including the zero-acceptance-number case
- Probability of acceptance tabulated across the defect rates that actually matter
Demonstration use only — see the notice above.
Custom tools
We build these for client teams, too
The same engineering goes into the applications we build for you — interactive Shiny and Streamlit apps, and custom Minitab macros and JMP scripts — deployed into your environment so your team can run the analysis themselves, without waiting on a statistician.
Statistical Programming & Applications- Reproducible analysis code in R and Python
- Interactive Shiny and Streamlit applications
- Custom Minitab macros and JMP (JSL) scripts
- Version-controlled and documented to support validation
Start a conversation
Want a tool like this for your own process?
Tell us the analysis your team repeats most. We’ll scope an application that puts it in their hands — validated, documented, and deployed where your data already lives.